=exp(ik·r)
with eigenenergy (in our dimensionless units): ½k2.
=exp(ik·r)
with eigenenergy (in our dimensionless units): ½k2.
=exp(ik·r)
with eigenenergy (in our dimensionless units): ½k2.
In the above solution uk=1, but we could just as well have:
uk=exp(iG·r)
which is a good periodic function if G is a reciprocal lattice vector. Thus the entire wavefunction would be:
=exp(ik·r) exp(iG·r) =
exp(i(k+G)·r)
with eigenenergy: ½(k+G)2. Thus for any given k in the Brillouin zone there are infinitely many eigenenergies and wavefunctions, each one "generated" from a reciprocal lattice vector G.
We now seek to understand how these eigenenergies depend on k. The dependence is, of course, very simple: just ½(k+G)2, but it turns out that ½(k-G)2, is easier to graphically display. For us that's not a problem because if G is a reciprocal lattice vector, so is -G. Thus if we see how all the vectors k-G behave we're also learning about how all the vectors k+G behave.
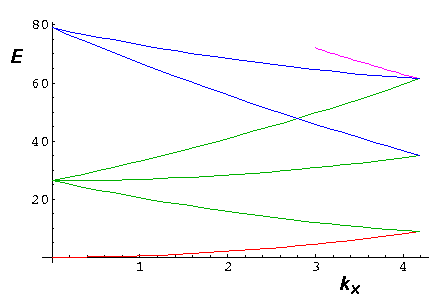
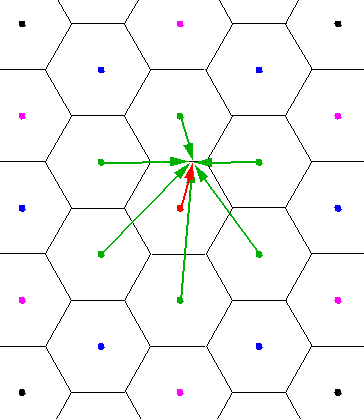
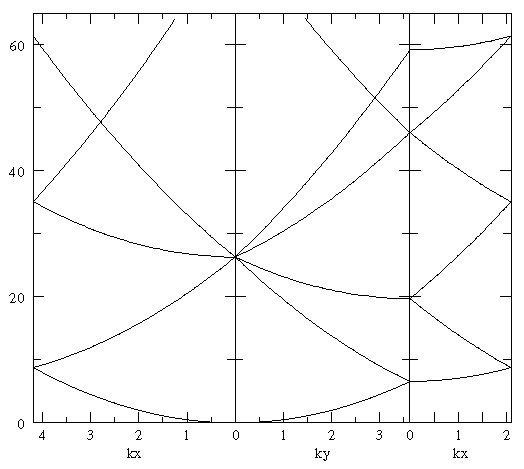
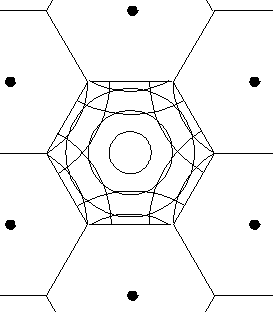
In the below we display the reciprocal lattice. I've coded the central Brillouin zone in red, the six nearest neighboring cells in green, the second nearest neighboring cells in blue, etc. Consider the red k vector moving out from k=0, along the x axis, toward the zone boundary. The six green vectors are k-G. Note that at k=0, the green vectors would all have the same length, and so the corresponding eigenenergies would be degenerate. As k lengthens, the degeneracy is broken, and we have three sets of doubly degenerate eigenenergies. One pair of eigenenergies is reduced as k lengthens, one pair increases slowly, and the final pair increases quickly with k. When k reaches the zone boundary the first-zone eigenenergy (red k vector) will be degenerate with a pair of nearest neighbor eigenenergies. A second pair of nearest neighbor eigenenergies, will become degenerate with an (not drawn) second-nearest neighbor eigenenergy.
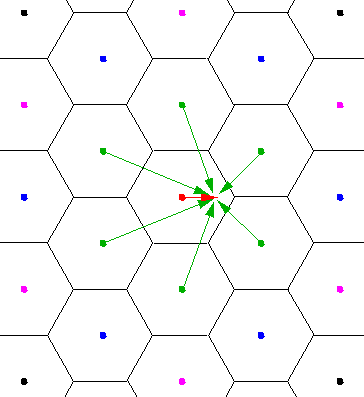
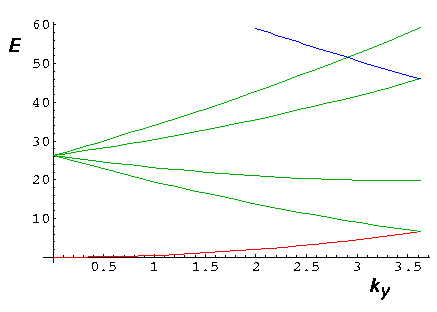
Consider the red k vector moving out from k=0, along the y axis, toward the zone boundary. The six green vectors are k-G. Note that at k=0, the green vectors would all have the same length, and so the corresponding eigenenergies would be degenerate. As k lengthens, the degeneracy is broken, and we have four bands: the lowest energy and highest energy bands are non-degenerate, the middle two are doubly degenerate. When k reaches the zone boundary the lowest energy nearest-neighbor has joined the first Brillouin zone in a degeneracy.
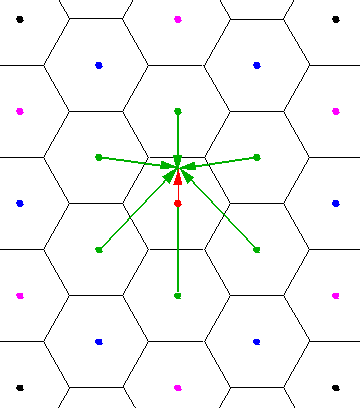
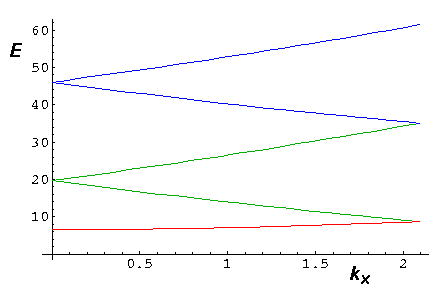
Consider the red k vector moving out from
k=(0, /3½) along the
zone boundary toward the point of the hexagon.
The six green vectors
are k-G. Note that at the start of the segment
there are many degeneracies caused by the symmetric reflection plane
parallel to the x and y axis. As we move from the
start of the segment, the y axis reflection plane
is not longer a symmetry. Note that in the below plot, every
band is also a "green band"...the sixth "green band" is
off this plot. Thus all the non-green bands are degenerate with a green
band; the two bands colored green are non-degenerate.
The end point of the segment is a point of 3-fold rotational symmetry.
At this end point all the bands are at least 3-fold degenerate.
/3½) along the
zone boundary toward the point of the hexagon.
The six green vectors
are k-G. Note that at the start of the segment
there are many degeneracies caused by the symmetric reflection plane
parallel to the x and y axis. As we move from the
start of the segment, the y axis reflection plane
is not longer a symmetry. Note that in the below plot, every
band is also a "green band"...the sixth "green band" is
off this plot. Thus all the non-green bands are degenerate with a green
band; the two bands colored green are non-degenerate.
The end point of the segment is a point of 3-fold rotational symmetry.
At this end point all the bands are at least 3-fold degenerate.
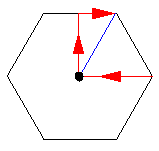
We can now put all of these pieces together and make a tour of reciprocal lattice space. The tour is shown in red, but note that the blue segment is identical to the first leg of the tour, and by symmetry the small triangle can generate the entire hexagon.
Another way to try to visualize the energy bands is by plotting constant energy curves. (These curves are related to Fermi surfaces in 3D problems.) Below find such a display for just the low energy bands (say, E<15)
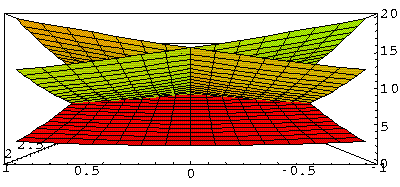
It may be hard still to visualize the bands...here is a "3D" plot where the z dimension is the energy value for the k value on the xy-plane. We look here into one of the corners of the hexagon.