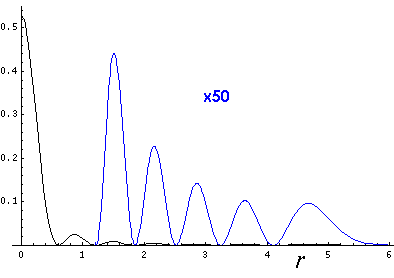

Qualitatively speaking, the ever smaller wavefunction as you move away from the origin is the result of flux conservation: an outgoing wave's probability amplitude is spread out over ever larger surface as r increases.
Mathematically we can see this as a breakdown of the assumptions of the WKB approximation:

whereas the R differential equation for the 3-d oscillator is:

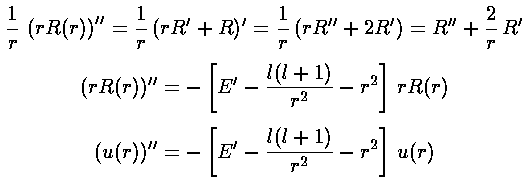
Thus the new "wavefunction" u=r satisfies the WKB-like differential equation.
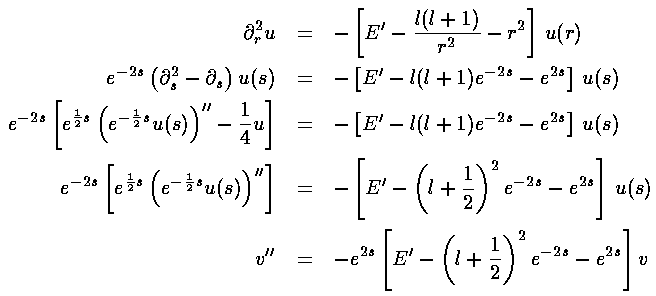
In order to solve the second problem we must perform a change of variables to move the zero of u at r=0 out to minus infinity. The transformation s=ln(r) does just what we want.

However, the differential equation for u in terms of s is no longer in the WKB form:

Thus is solving second problem, we've screwed up the first and must now work to again get the differential equation into WKB form:

Putting these results into our differential equation finally gives us a WKB form in s (and hence with WKB behavior at infinity).
We can now read off the position dependent wavenumber k
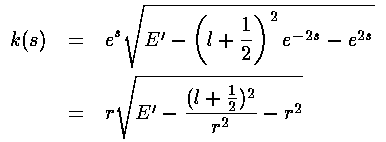
Note that essentially what has happened is the centrifugal barrier term l(l+1)/r2 has become (l+½)2/r2, a small correction of order l-2.
The wavefunction v is given by:

The integral of k can be rearranged to give:
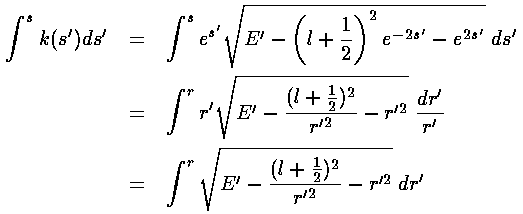
Now to get the WKB estimates for the eigenenergies
we must integrate k through the allowed region.
The allowed region should include
n+½ half-waves, i.e., a phase of
 (n+½). With a little
work on the complex plane we can evaluate that integral exactly:
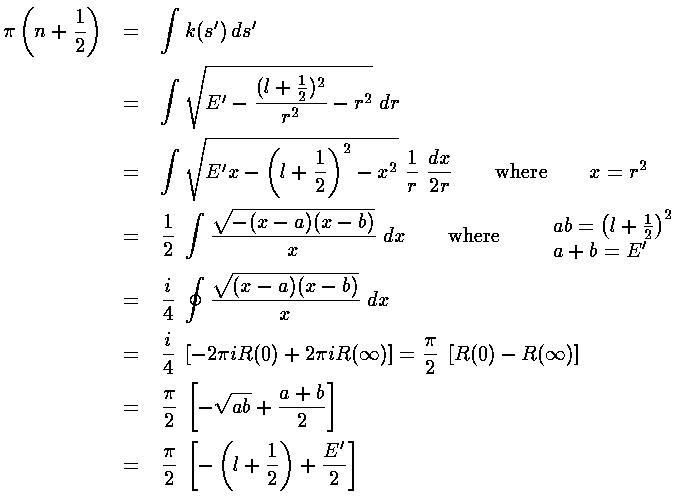
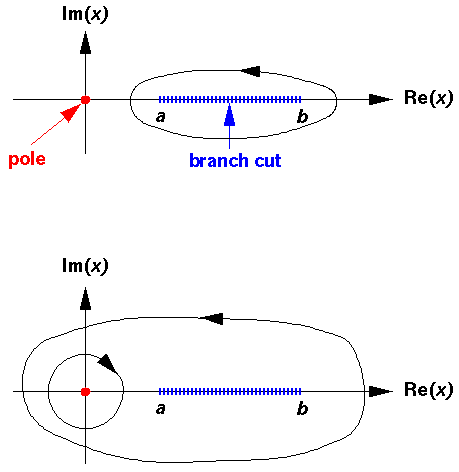
exactly reproducing the correct result:
E'=4nr+2l+3
So the bottom line is that if you plot r along with the effective potential with (l+½)2
rather than l(l+1) things should look as in the
1-d case. In fact, this is how you will find most books displaying
3-d wavefunctions. Here is a repeat stacked wavefunction plot
(for l=0,1,3) following this
formula.
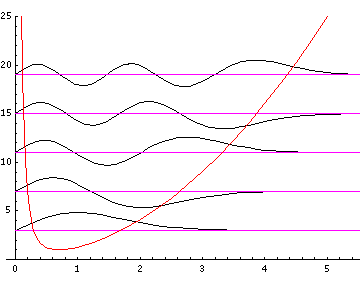
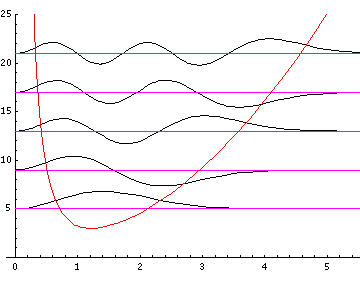
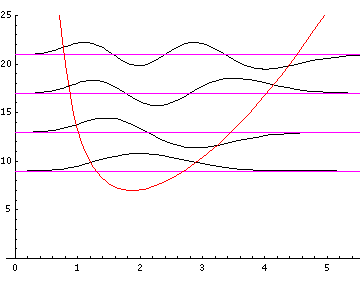
Here is the nr=32 l=0 (probability density)×r2 plotted along with the WKB result (in red):
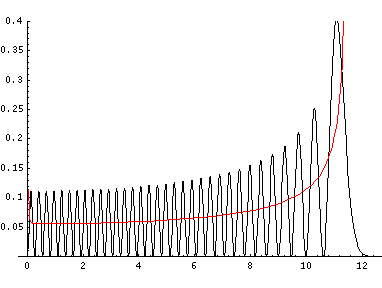
Note that while these plots look more "normal" they hide the fact that the probability density is highest near the origin, rather than at the far r turning point.