The Deflection of a
Curveball in Baseball and Fast pitch Softball
Anna Tapio
Physics Department
Saint John’s
University
Collegeville,
MN
Introduction
Baseball
is not simply a sporting event – it is physics, especially the curve ball. People curiously studied the physics of a
pitch for years – whether balls actually curved during flight. The work of Daniel Bernoulli, Bernoulli’s
Principle, and Heinrich Magnus, the Magnus Effect, holds most importance when
examining the physics of a curve ball.
Consider a spherical baseball as fluid in
motion through air. According to
Bernoulli’s principle, a pressure difference surrounds the baseball along its
boundary layer. The air pressure at the
front of the baseball is greater than the pressure at the top since as the ball
accelerates, its kinetic energy increases (Bahill 42). As air travels beyond the top of the
baseball, its speed decreases, thus its pressure decreases. In the region behind the baseball, the fluid
flow experiences a disruption since the viscosity of air is not zero, called
the wake region (Bahill 46). Within the
wake region, a swirling flow occurs due to the spinning of the baseball,
similar to the swirling behind boats. This
wake affects the curve of a curve ball.
The
Magnus Effect suggests that if the air resistance is greater on one side of the
ball, the ball will curve in the opposite direction (Adair 26). For instance, the wake region behind a
baseball creates a drag force. Since the
wake is uneven, the created force redirects the path of the pitch as well as
decreasing its velocity. The spin of the
baseball will shift the wake region, causing the ball to curve left or
right. Clockwise spin curves the ball to
the right, whereas counterclockwise spin curves it to the left (Bahill 48). The force from the spin and velocity of a
pitch has an equation of
F = 0.50πρωvR3
(1) (Bahill 76)
or F = (2mdv2)/
l2 (2) (Bahill 26)
where
ρ is the density of the fluid, ω is the rotation rate, or spin, v is
the velocity of the pitch, R is the radius of the ball, d is the deflection,
and l is the length from the pitcher’s mound to home plate. Applying this force to simple laws of motion yields
an equation for the deflection of the curve ball of
d =
(πρωl2R3)/(4mv) (3)
(Bahill 77)
Equation (3) shows that the
deflection of the curve ball has a linear relationship with the rotation rate. Conversely, the deflection has an inverse
relationship with the pitch velocity. Thus,
many combinations of pitch velocity and spin produce differing curve balls and
deflections.
The Experiment/Program
Fast
pitch softball follows the same physics as baseball. Pitchers in both games throw similar pitches,
including the curve ball. In order to
compare the curve balls in baseball and fast pitch softball, I created a
program in Fortran 90. My first goal for
this program was to compare the deflection of a curve ball in baseball versus softball. The second goal of my program was to
determine the relationship between force and shape. Throughout all calculations, the softball and
baseball undergo the same pitch velocities, as seen in tables 2 and 3 below. Table 1, as seen
below, shows the constants used throughout all calculations in the program.
Table 1 Values
used in calculations of deflection and force
|
|
Radius
(m)
|
Spin (rad/s)
|
Mass (kg)
|
Distance
to Home Plate (m)
|
|
Baseball
|
0.038
|
199
|
0.1488
|
16.76
|
|
Softball
|
0.0486
|
156
|
0.1878
|
0.1878
|
Using
equations (1) and (3), the program first calculated the deflections and forces
for the baseball and softball. The
program then graphed deflection versus velocity, in order to compare the
differing deflections of the baseball and softball. I expected that the
softball would have smaller deflections than the baseball, since the softball
is larger in volume.
My
program then calculated the forces on a baseball and softball for curve balls
with similar deflections and velocities.
By comparing the ratio of the forces to the ratio of the volumes, I
could determine the relationship between force and volume. I performed the comparison with three
deflections and three velocities, as seen in tables 2 and 3 below. I expected to find that the ratio of forces would
approximately equal the ratio of volumes since deflection depends on shape, as
seen in equation (3).
Results
My
program provided three tables and two figures from the calculated data. Tables 2 and 3, as seen below, show the
different deflections and forces calculated with constant rotation rates and
similar pitch velocities for the softball and baseball, as well as with similar
velocities and deflections.
Table 2 Baseball Data Collected in Fortran 90 Program
Baseball Data at spin = 199 rad/s
Velocity (m/s) Deflection (m) Force (N)
===================================
22.352 0.905
0.4792
23.246 0.871 0.4984
24.140 0.838
0.5176
25.034 0.808 0.5367
25.928 0.781
0.5559
26.822 0.754
0.5751
27.716 0.730
0.5943
28.611 0.707
0.6134
29.505 0.686
0.6326
30.399 0.666
0.6518
Baseball Data at Similar Deflection and
Velocity
Velocity (m/s) Deflection (m) Force (N)
====================================
22.352 0.100
0.0529
23.246 0.300
0.1718
24.140
0.500
0.3087
Table 3 Softball Data Collected in Fortran 90 Program
Softball Data at spin = 156 rad/s
Velocity (m/s) Deflection (m) Force (N)
===================================
22.352 0.821 0.7839
23.246 0.790
0.8152
24.140 0.760
0.8466
25.034 0.733
0.8780
25.928 0.708
0.9093
26.822 0.684
0.9407
27.716 0.662
0.9720
28.611 0.641
1.0034
29.505 0.622 1.0347
30.399 0.604
1.0661
Softball Data at Similar Deflection and
Velocity
Velocity (m/s) Deflection (m) Force (N)
===================================
22.352 0.100
0.0955
23.246 0.300
0.3098
24.140 0.500
0.5568
Figure 1,
as seen below, is a graph of deflection versus velocity where the deflection is
not similar.

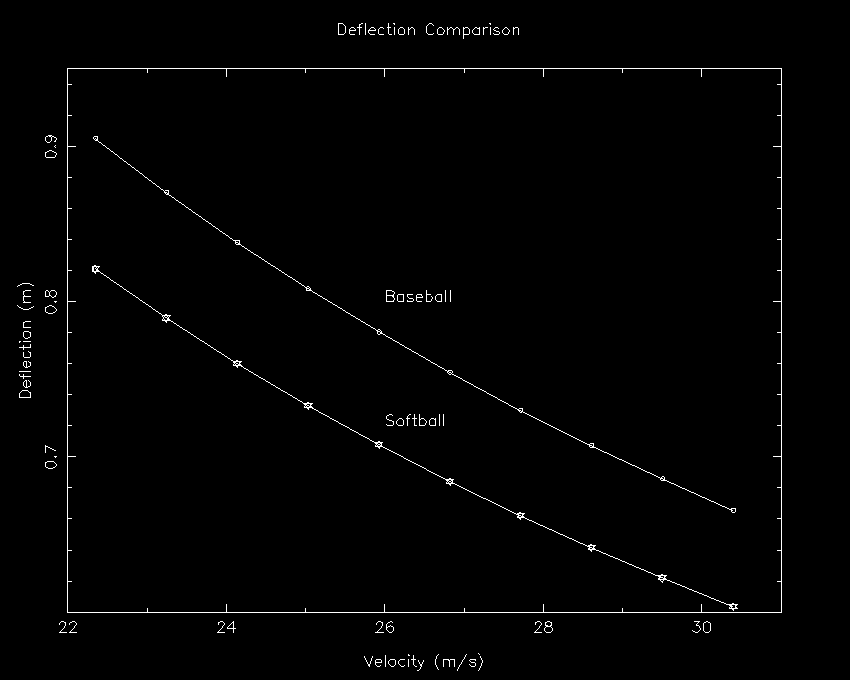
Figure 1:
Graph of deflection versus velocity for the baseball and softball.
My program also calculated the
ratio of the forces and ratio of the volumes under similar deflections,
printing these values to the screen. The
following figure depicts an example of this outputted information.
amtapio@lin23.cs.csbsju.edu
30% curve
The spin of the softball
is 155.5967
Ratio of forces is 1.803618 1.803618 1.803618
Ratio of volumes is 2.091983
Figure 2 Output
from program printed to the screen
These tables and figure allowed for
the comparison of deflections of the softball versus the baseball, permitting
me to interpret the relationship between the force on the curve ball and shape
of the ball used.
Discussion
From the data my
program calculated, I saw that my expectations were correct. In calculating deflections under constant
rotation rates and similar velocities, the deflections of the softball were
smaller than the deflections of the baseball.
Furthermore, I saw that the force on the curve ball relates to the shape
of the ball.
As
seen in tables 2 and 3, when the deflections vary, the
softball has deflections approximately 0.1 meter smaller than the deflections
of the baseball. Figure 1 also confirms
that at similar velocities with varying deflections, the deflections of the
softball are smaller. The deflections
values themselves, however, are erroneous.
The values suggest that the baseball and softball deflect at maximum
values of roughly 0.9 and 0.8 meters, or almost 3 feet. Even the minimum values suggest deflections
of almost 2 feet. Yet the width of home
plate is only 17 inches or approximately 1.5 feet. The values thus claim that the curveballs
deflected between the width of home plate and twice of that width. Personal observations of baseball and
softball games, however, depict curve balls with significantly smaller deflections. These results suggest that errors occurred in
the program.
One
possible error is the values for the rotation rates. The rotation rates of the softball and
baseball are 156 and 199 radians per second, respectively (Bahill 68). These values may not be the true values of the
rotation rates since research came exclusively from books and personal
experience for this program. Finding
more accurate rotation rates may produce reasonable deflection values. Another possible error results from the
assumption that the two shapes are spherical.
For instance, the program does not account for the effect from the
laces. Furthermore, the radii are
average values, not an exact value. Regulation
radii of softballs and baseballs must fall within a range of values, giving
uncertainty to the radii used in this program.
Lastly, the velocity values of 22 to 31 meters per second, or 50 to 70
miles per hour, are estimates based on pitch speeds taken from personal
observations of softball and baseball games.
Tables
2 and 3, as well as figure 2, shows that the force relates closely to the shape
of the ball. Figure 2 illustrates that
the ratio of the forces is approximately two; therefore, a fast pitch softball
pitcher must exert twice the force than a baseball pitcher in order to achieve
the same deflection. This increase in
force relates to the shape of the ball. Equation
(2) shows that the deflection of the curve ball has a linear relationship with
the shape of the ball used. The volume
of the softball is approximately twice the volume of a baseball. Since the force exerted on the ball relates
linearly to the deflection, the shape of the ball directly affects the force. Future research regarding the path of the
curve ball, more accurate rotation rates, and the actual speed range of this
pitch would provide more insight to the curve ball, as well as providing logical
values of its deflection.
References
Adair, Robert K. The Physics of Baseball. New York: Harber and Row Publishers, 1990.
Bahill, Terry A.
and Robert G. Watts. Keep Your Eye on the Ball – The Science and
Folklore of Baseball. New York: W. H. Freeman
and Company, 1990.
Chapman, Stephen J. Introduction to Fortran
90/95. New York: WCB McGraw-Hill, 1998.
Acknowledgements
The
author would like to acknowledge Professor Jim Crumley for his help in creating
her program.